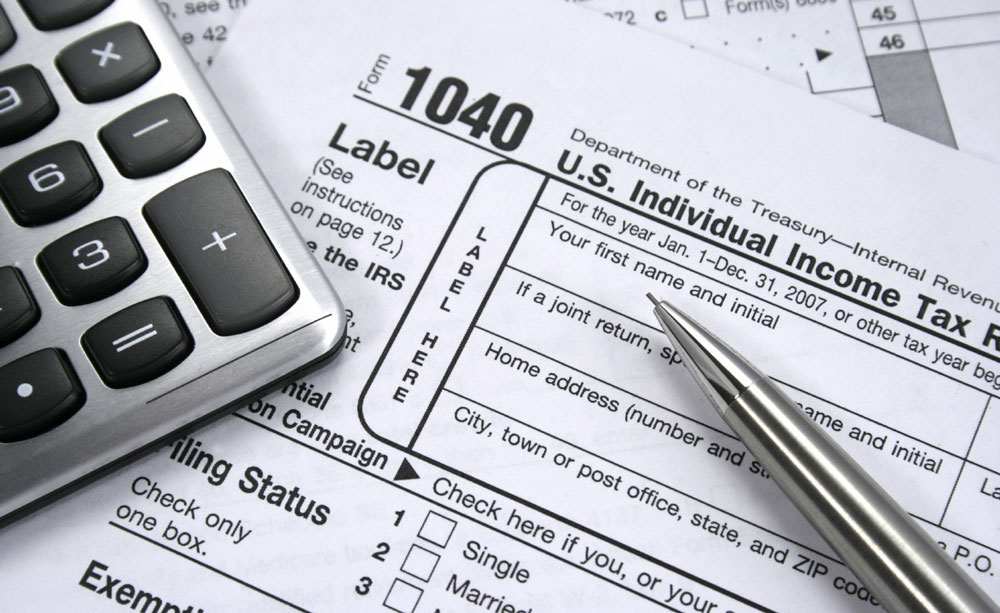
Tax Day can be a painful reminder of how much we have to invest in federal, state and local governments, though many of us are unaware of exactly what they give us in return. As a result, this creates a disconnect in the minds of taxpayers between the amount of money we should fork over every April and how much we deserve in return.
Perhaps that’s why, according to WalletHub’s Taxpayer Survey, 55% of U.S. adults feel they pay too much in taxes and why 90% don’t think that the government uses tax revenue wisely. We do know, however, that taxpayer return on investment, or ROI, varies based where one lives. Federal income-tax rates are uniform across the nation, yet some states receive far more federal funding than others. But federal taxes and support are only part of the story.
Different states have dramatically different tax burdens. This begs the question of whether people in high-tax states receive superior government services. Likewise, are low-tax states more efficient or do they receive low-quality services? In short, where do taxpayers get the most and least bang for their buck?
WalletHub aimed to answer that question by contrasting state and local tax collections with the quality of the services residents receive in each of the 50 states within five categories: Education, Health, Safety, Economy, and Infrastructure & Pollution. Our data set includes a total of 30 key metrics. Read on for our findings, methodology and commentary from a panel of experts.
Taxpayer ROI in Florida (1=Best, 25=Avg.):
- 3rd – Overall ROI
- 3rd – Total Taxes per Capita (Population Aged 18+)
- 9th – Education
- 36th – Health
- 37th – Safety
- 38th – Economy
- 35th – Infrastructure & Pollution
For the full report, please visit:
https://wallethub.com/edu/state-taxpayer-roi-report/3283/


 Calla Blow Dry
 My Derma Clinic


 The Dog from Ipanema


 ATR Luxury Homes

 Hamilton Fox & Company

 Best Pest Professionals


 Cutler Bay Solar Solutions
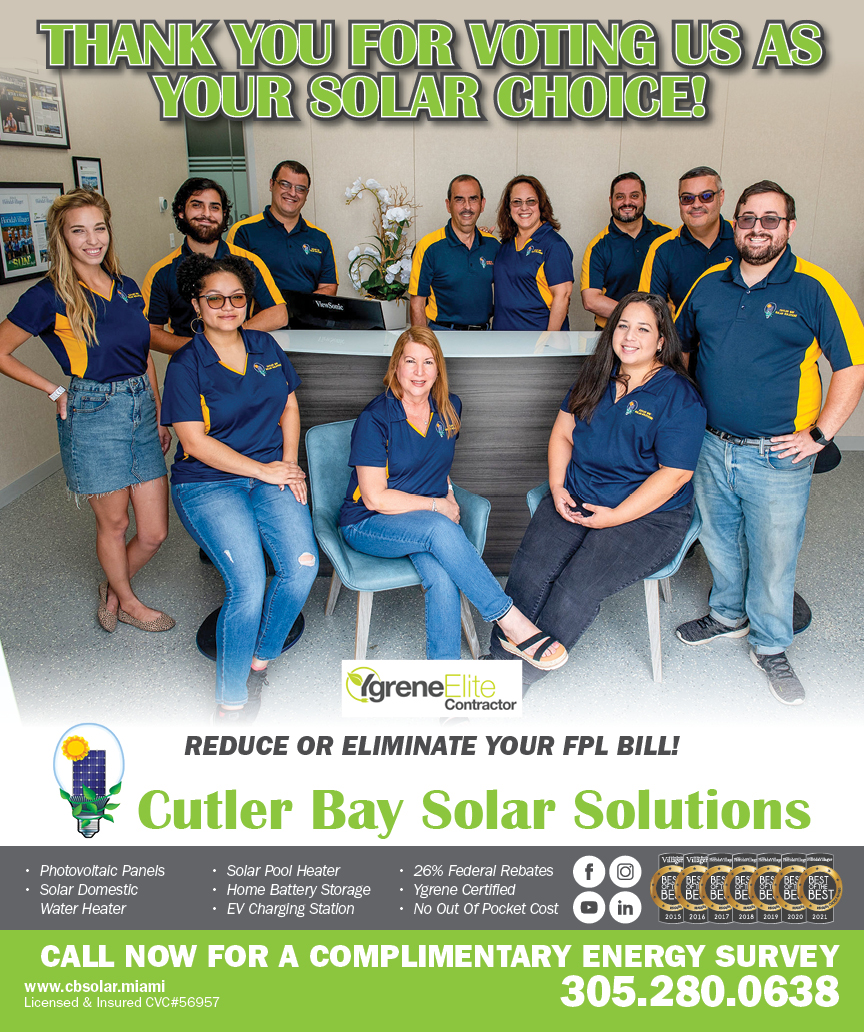


 Lil’ Jungle
 Frost Science Museum

 South Florida Music
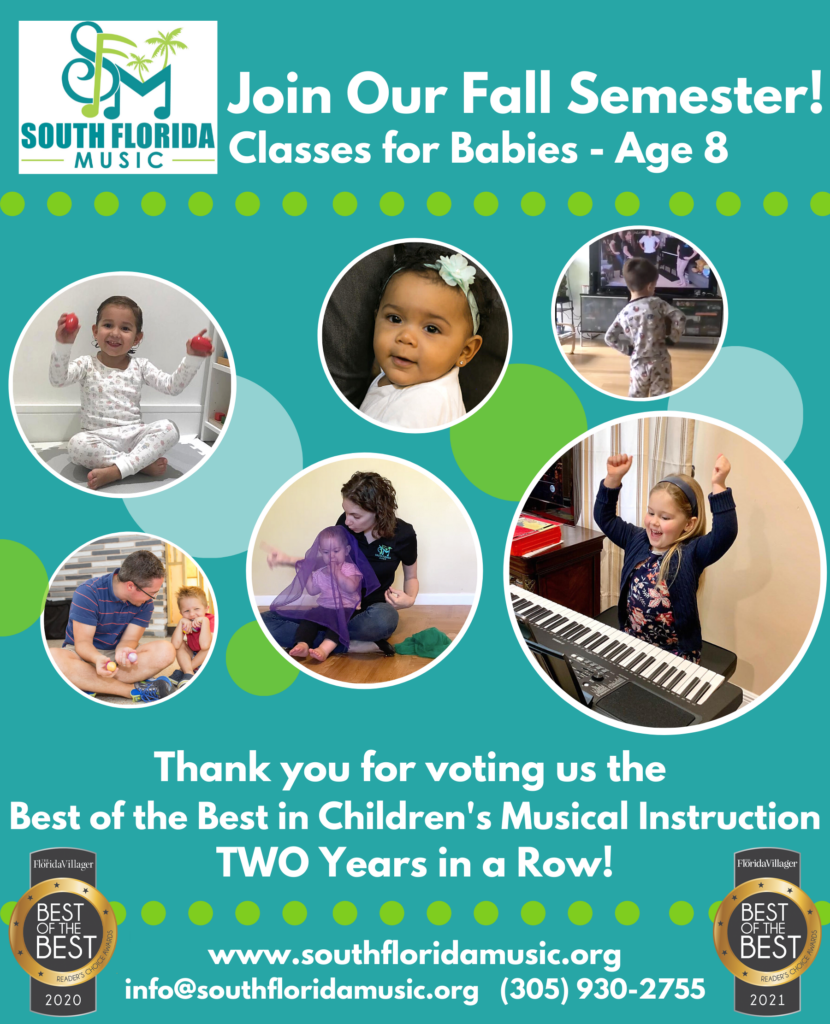
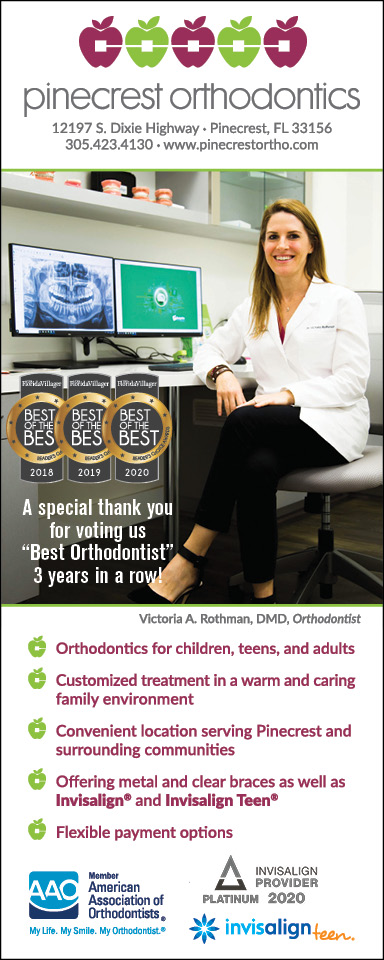
 Pinecrest Orthodontics
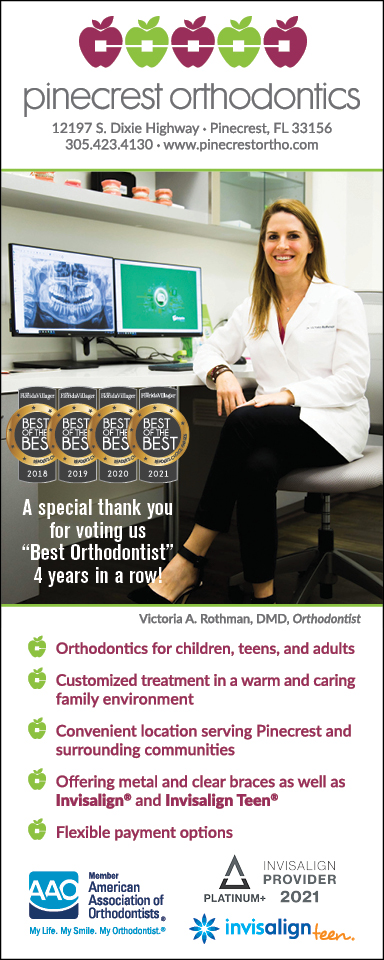
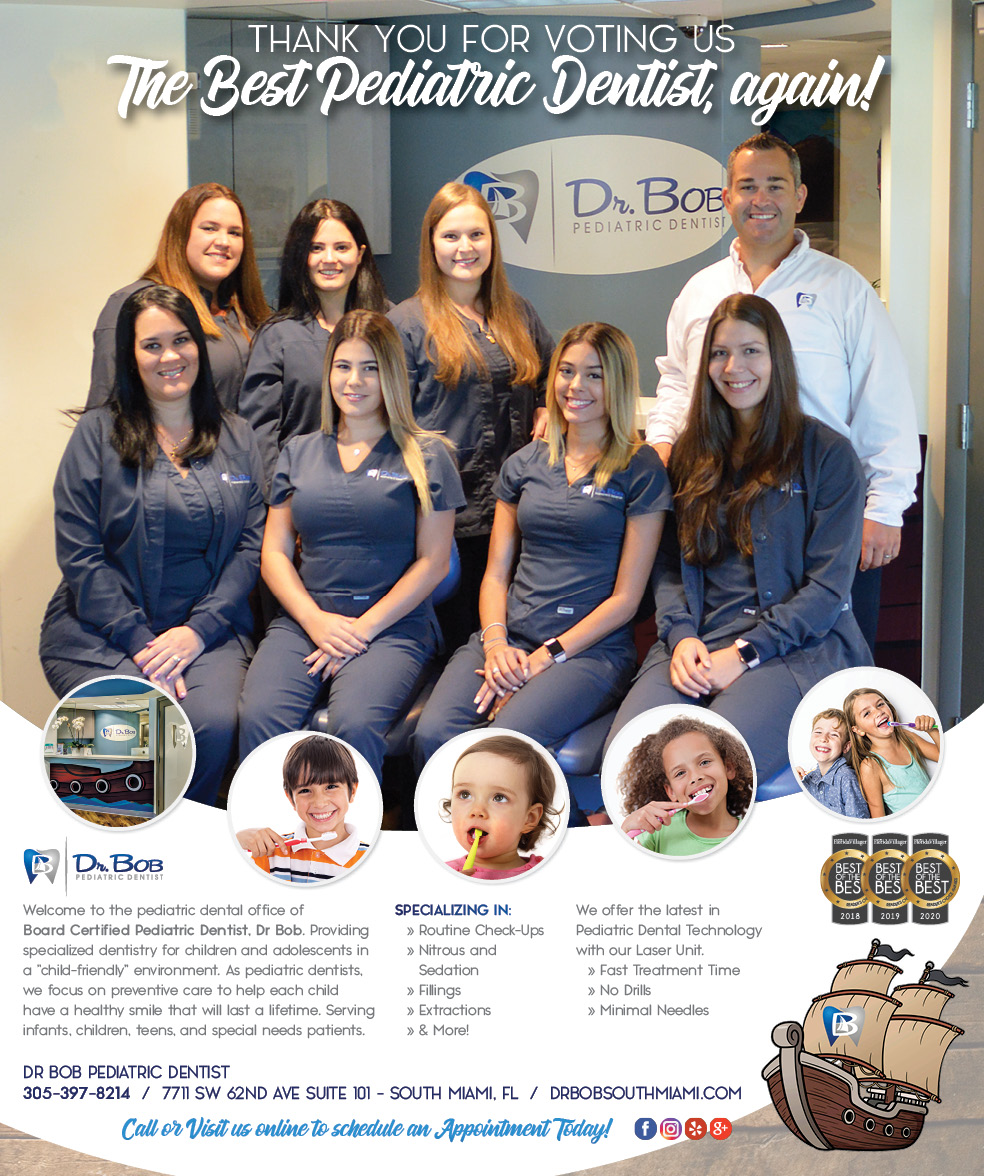
 Dr. Bob Pediatric Dentist
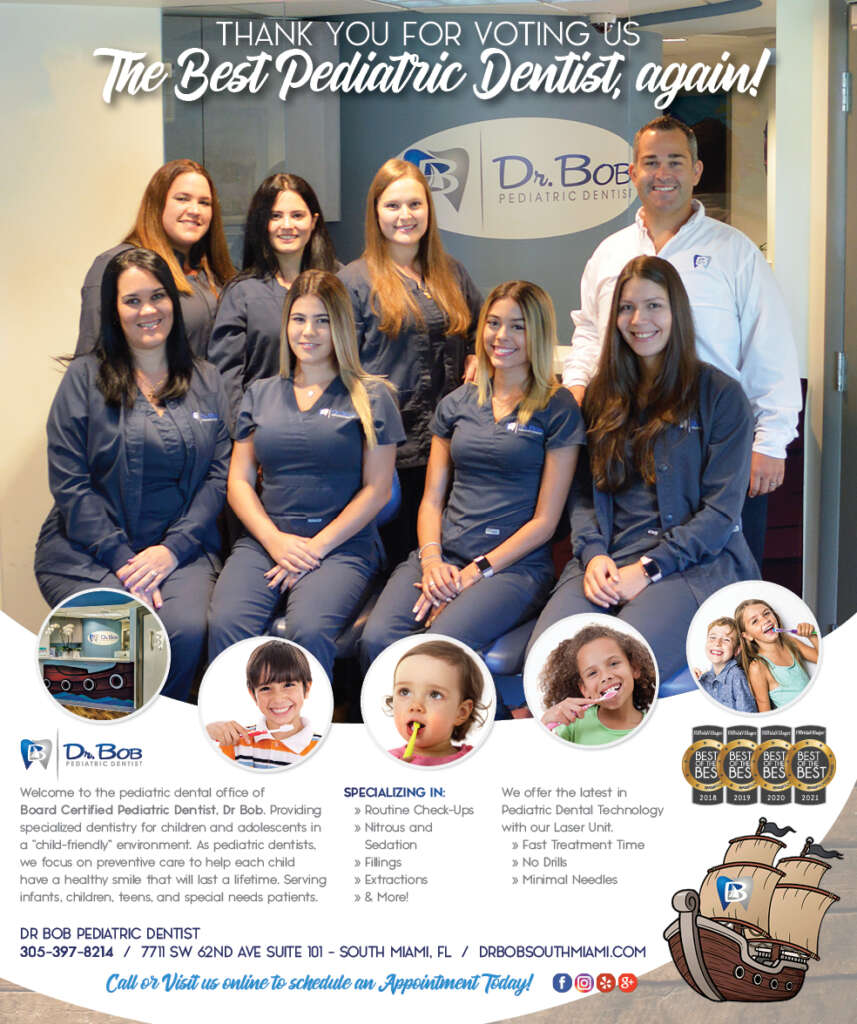


 My Derma Clinic
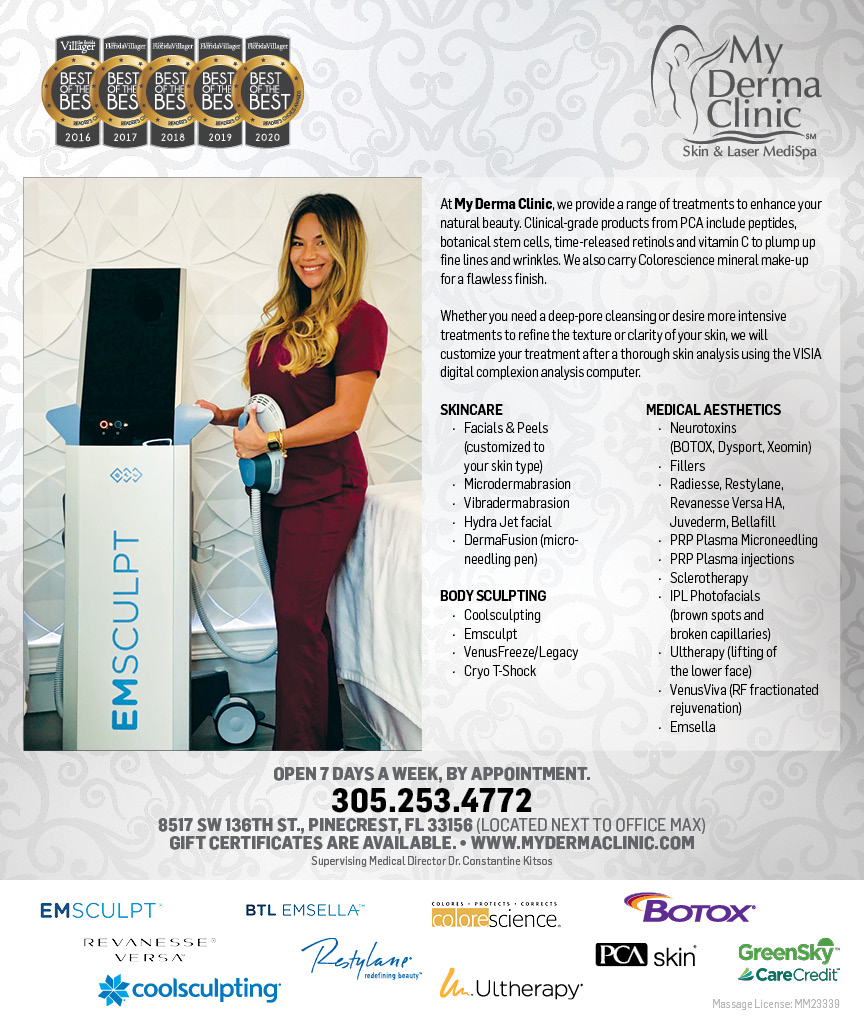


 Miami Dance Project


 Baptist Health South Florida
 Laser Eye Center of Miami
 Visiting Angels


 Hamilton Fox & Company